
Are you responsible for running a Cisco Callmanger install for your company? If so, you’d probably like to be the first one to find out about telecom problems – before your users start coming to get you. I was in a similar situation when I began looking for a monitoring and alerting solution for our Callmanager cluster. In the past, we had purchased a solution that required probes to be put at each one of our remote sites, and since that company had gone belly up, I didn’t want to go down that road again. We eventually settled on using SNMP to monitor the Call Manager and all remote sites, with Cacti pulling everything together.
In this article we’ll go over the basics of Callmanager monitoring:
- Enabling SNMP on your Cisco routers, switches and Callmanagers (At the time of this writing, these are working on my Callmanager 8.5 cluser, but should work on anything 7 and up)
- Adding Callmanager and Cisco devices to Cacti
- Configuring Cacti to alert when a device goes down
For anyone who isn’t familiar with Cacti, it’s an open source graphing solution that makes great little bandwidth graphs. If you’d like to learn more about Cacti, and download a ready to go virtual machine, just go to Cacti Users and download their bootable ISO. I’d suggest using the vm player from VM Ware and creating your new Cacti install inside of a virtual machine – you should be up and running inside of an hour.
Enabling SNMP on your Cisco routers, switches and Callmanagers
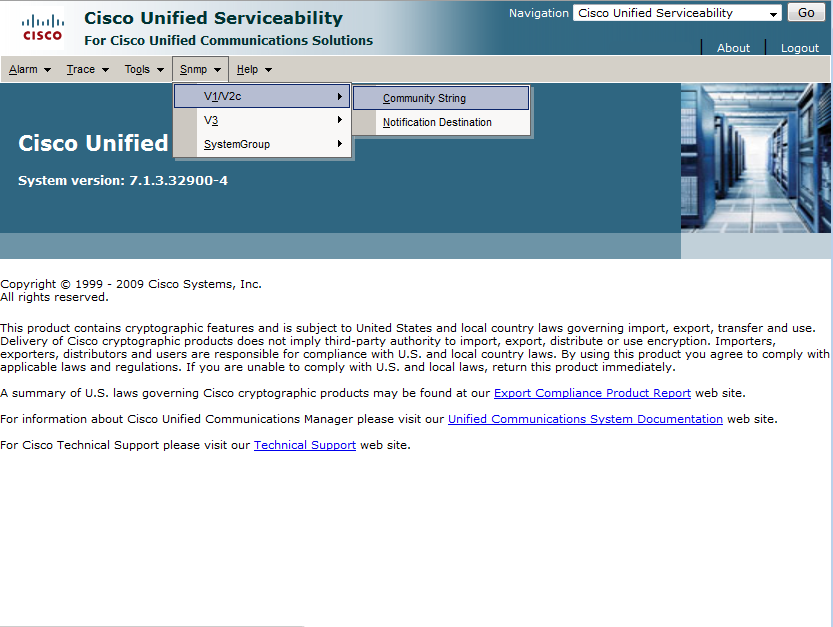 Once you have Cacti up and running, you should setup SNMP on Callmanager and your remote sites. To setup SNMP on Call Manager, just log into your CallManager’s serviceability page and click on Snmp, and for each member of your cluster, you’ll want to setup a ReadNotifyOnly community string – if you have any problems then take a look at this document (this is for CallManager 7, you may need to search Cisco.com for a different doc if you have another CallManager version).
Once you’ve got SNMP setup in Callmanager, you’ll need to setup SNMP on all of your voice routers and switches. This is a pretty straightforward setup for most Cisco routers. Just login to your router, enter global config and enter this:
snmp-server community YourMadeUpString RO
Where YourMadeUpString is your Community string (a string of characters that you made up, and allows access to SNMP data). This will allow any device on your network to poll this router for information, in read only mode. You’ll want to do this on all the routers and switches on your voice network.
Now that we’ve setup all the voice devices to respond to SNMP, we’ll want to configure Cacti to poll them for information every 5 minutes. In this article we’re just adding them to our CactiEZ config, in later articles we’ll talk about getting more data from them.
Adding Callmanager and Cisco devices to Cacti
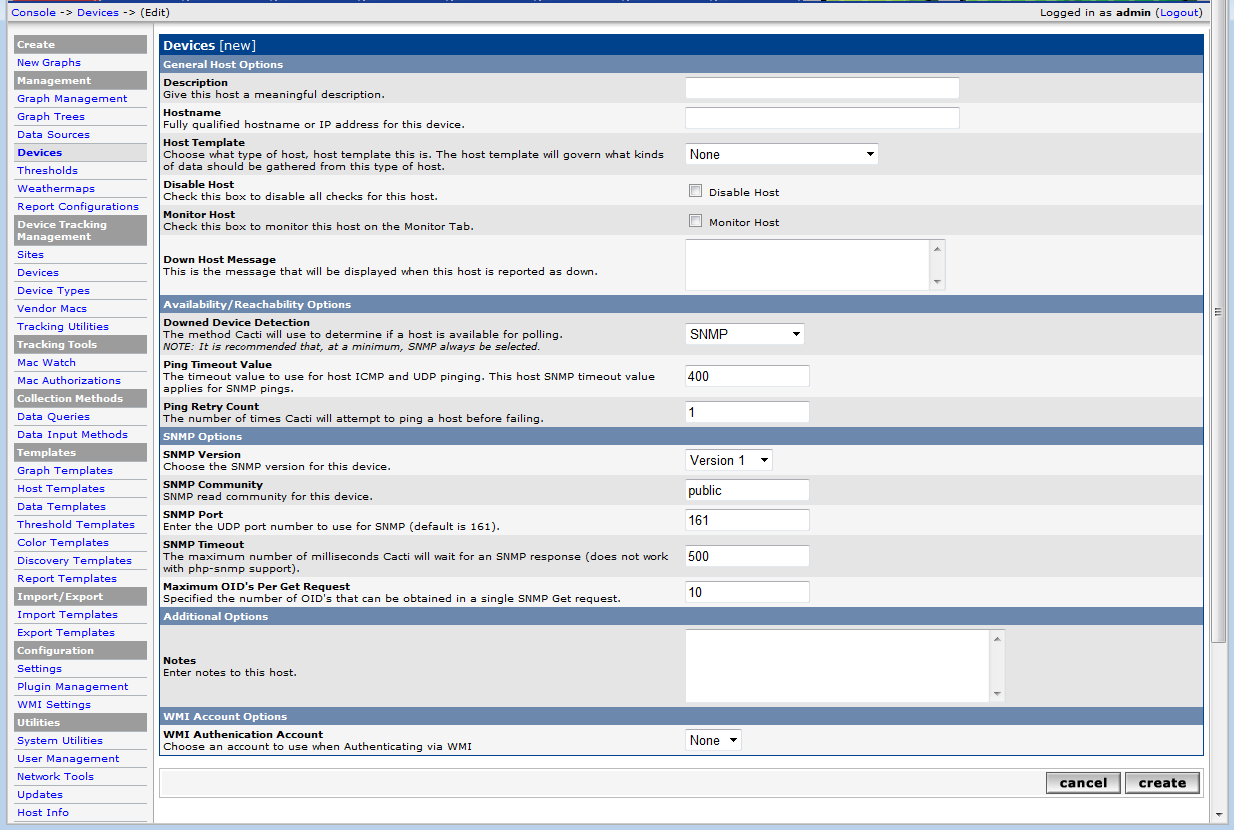 Log into your CactiEZ install by making sure the VM is powered on, then opening the IP address shown in your browser. Add a router to Cacti by clicking on devices, then add in the upper right of the screen. You’ll fill out a description (i.e. Home office voice router), add the IP address for host name, check the monitor host button, and enter the SNMP community string that you picked earlier. This should be all you need – so press the create button. Your new router will show with a status of “unknown” for 15 minutes until Cacti is able to properly poll it, then it will change to “up”.
Graphing Call Manager with the default graphs
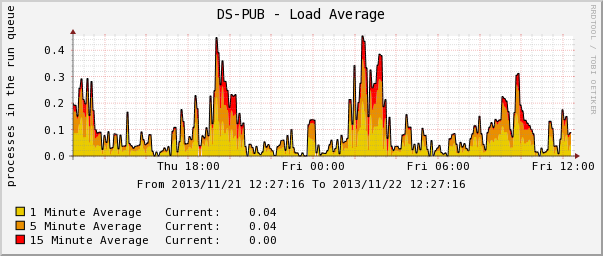
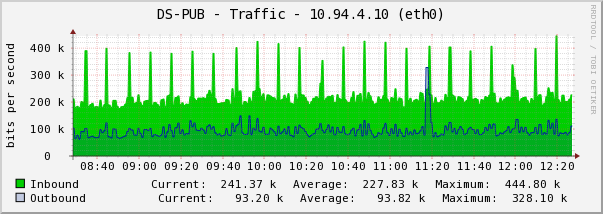
Now we’re able to add some graphs that will let us track basic things like the load, memory usage, and network traffic to callmanager. These graphs are all included in Cacti, and will produce graphs like this:

These graphs are enabled by going to to the device in cacti, and:
- select “Create Graphs for this Host” from the upper right hand corner.
- Choose the following (one at a time):
- Host MIB – CPU Utilization
- Unix – Load Average
- Select the correct interface for each of the following
- Interface – Traffic (bits/sec)
- Host MIB – Available Disk Space
- Click create
These should all work on your Call Manager 7+ publisher and subscribers.
Custom Cacti templates for Call Manager
Now comes the good stuff – actually graphing CUCM specific stuff.
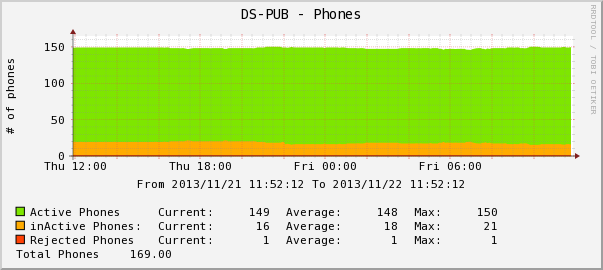
- Number of phones – This template will allow you to graph the number of active, inactive, and rejected phones registered to this specific server. If you want to see all the phones registered to the cluster you should add this template to your publisher and subscribers, then use the cacti aggregate plugin to total things up.

[wpdm_file id=3]
- Phone calls – This template will report on the number of active phone calls on a PRI. Note that this will summarize all PRI calls on the router – meaning that if you have calls across multiple PRIs in the same router, they should all be reflected in the graph.
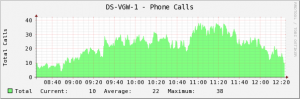
Graph of PRI based phone calls across a Cisco router [wpdm_file id=4]

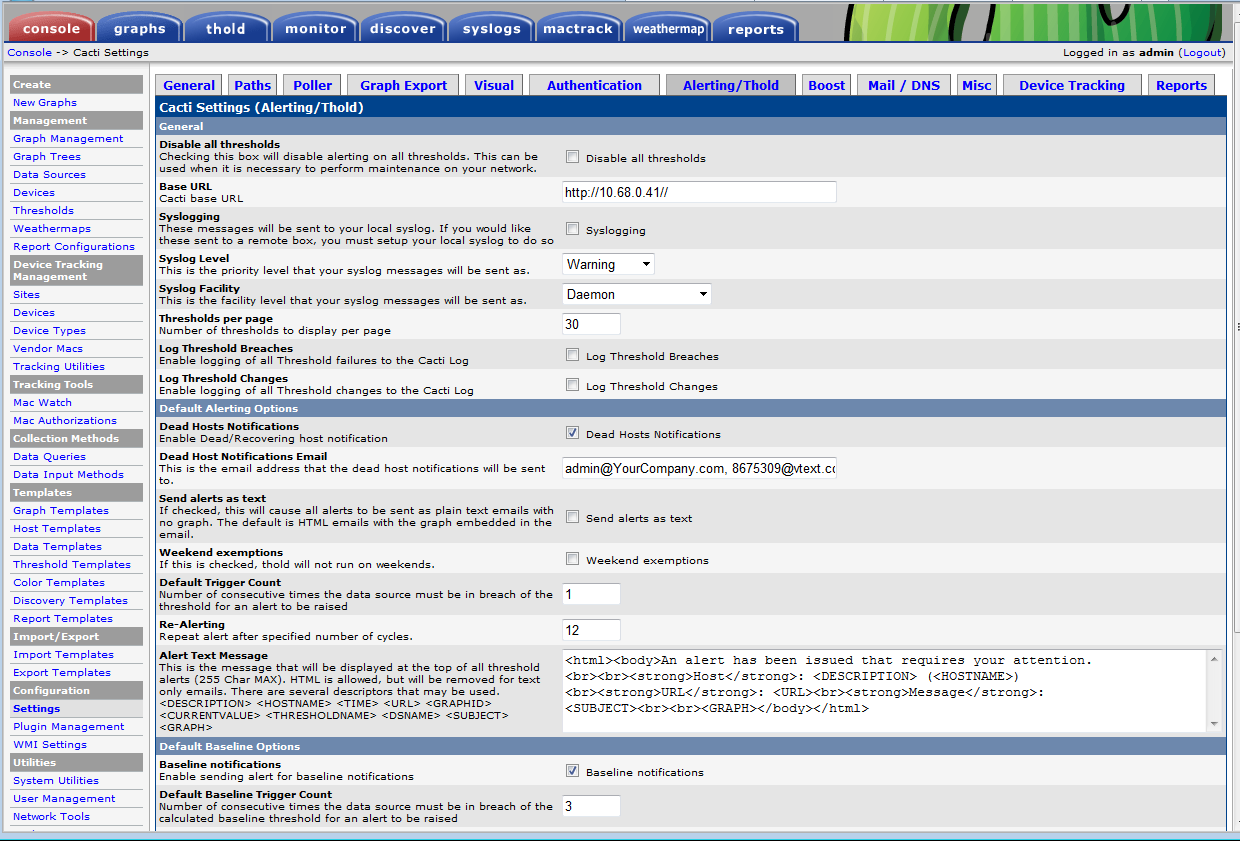
Configuring Cacti to alert when a device goes down
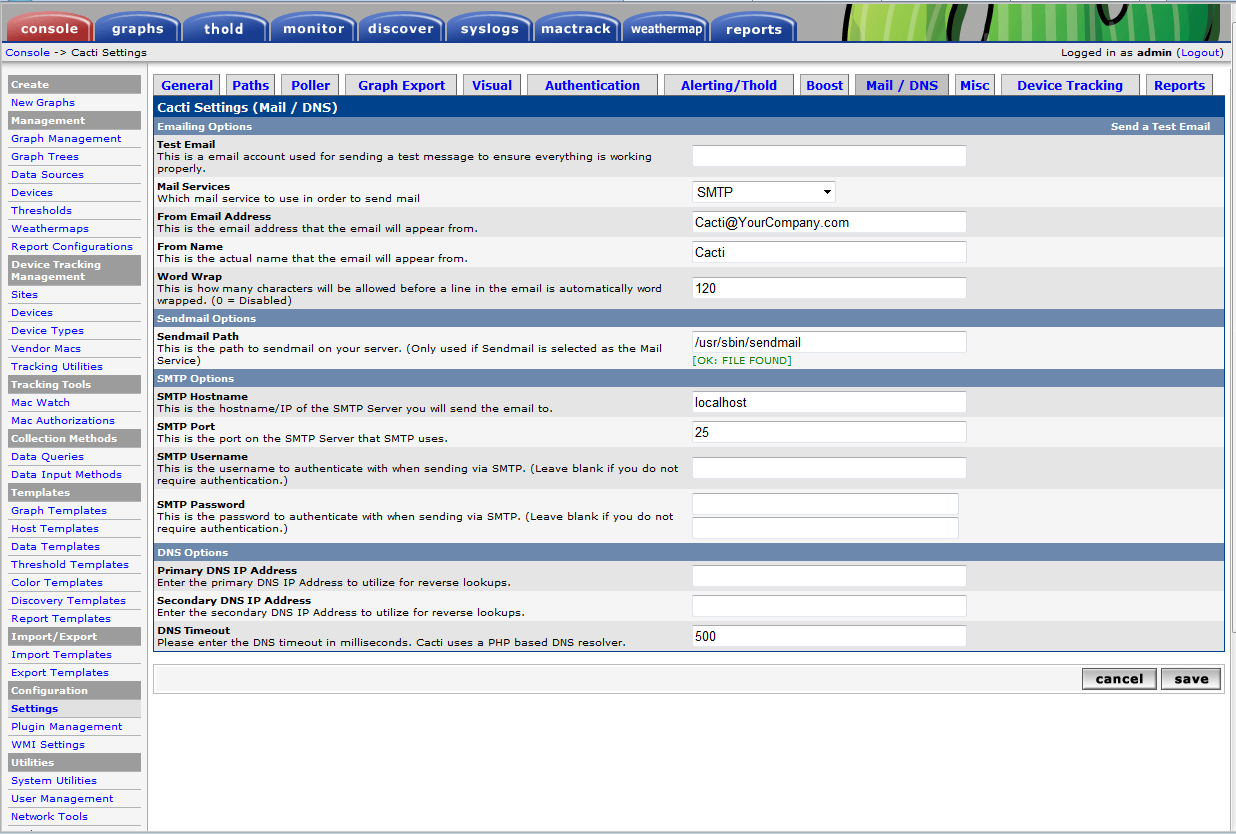 Now that you’ve got your router setup in cacti, all we need to do is input some alerting information. Click on the setting link on the left side of CactiEZ, and then on the Mail / DNS tab. You’ll want to configure your Emailing Options according to your organization’s settings (most likely it will be SMTP, using a corporate mailserver).
 Now, you’ll need to enter your alerting information. I like to put both my corporate email and my phone’s text message address in, so that I’ll get an alert where ever I am – the downside is that you’ll eventually get alerts at 3am…
Now, you can move on to adding routers, switches, your Callmanagers, Unity, Contact Center, etc to cacti. Each one will be automatically tracked for up / down status. Using other tools inside of CactiEZ such as thold, you can set alerts if the load on Callmanager gets too high, or if a remote circuit goes down. The best part of this solution is that it costs nothing and is well supported by the Cacti community.
I’m new to using Cacti and are mutteling my way through the setup/configuration. I have noticed on the graphs that the time is not the local time. How can I either check and or change the time server information in this server.
Hi,
I’m a newbie to cacti and just downloaded your template.
i get the following error from the cli;
$php -q ss_total_snmpwalk.php 1.1.1.1 .1.3.6.1.4.1.9.9.63.1.3.2.1.6
PHP Fatal error: Call to undefined function cacti_snmp_walk() in /usr/share/cacti/resource/snmp_queries/ss_total_snmpwalk.php on line 29
from the gui it shows this;
04/09/2016 03:30:09 PM – CMDPHP: Poller[0] Host[24] DS[1901] WARNING: Result from SERVER not valid. Partial Result: U
04/09/2016 03:30:09 PM – PHPSVR: Poller[0] WARNING: Function does not exist INC: ‘ss_total_snmpwalk.php’ FUNC: ‘ss_total_snmpwalk’ PARMS: ‘1.1.1.1 .1.3.6.1.4.1.9.9.63.1.3.2.1.6 XXXXX 2 161 500’
04/09/2016 03:30:09 PM – PHPSVR: Poller[0] WARNING: PHP Script File to be included, does not exist
what am i missing? i copied the file to both snmp&server queries folder.
thanks
hi folks,
just a quick update.. I managed to get it to graph! yay!
I duplicated the graph template and i changed the graph template to use “items” instead of “total”… this correctly reflects what I see with a snmp get.
I suspect I may not have been getting “totals” as it was resolving the OID value of “2” to “cisco”.. ie., a string.. which it obviously couldn’t sum!
thanks for posting the missing script..
i’m a bit of a cacti rookie so I still haven’t been able to get it to work.
my poller cache for the device says “Script Server: /proj/www/cacti/scripts/ss_total_snmpwalk.php ss_total_snmpwalk .1.3.6.1.4.1.9.9.63.1.3.2.1.6 2 161 500 ”
(I have removed the hostname/community from the output) is that what I should expect? when I run it from the CLI it returns 0… (items:0 nonzero:0 total:0)
but when I do a snmpwalk..
snmpwalk -r 1 -v 2c -c cvVoIPCallActiveSessionProtocol
CISCO-VOICE-DIAL-CONTROL-MIB::cvVoIPCallActiveSessionProtocol.929472063.1 = INTEGER: cisco(2)
CISCO-VOICE-DIAL-CONTROL-MIB::cvVoIPCallActiveSessionProtocol.929507554.1 = INTEGER: cisco(2)
CISCO-VOICE-DIAL-CONTROL-MIB::cvVoIPCallActiveSessionProtocol.929508446.1 = INTEGER: cisco(2)
CISCO-VOICE-DIAL-CONTROL-MIB::cvVoIPCallActiveSessionProtocol.929513228.1 = INTEGER: cisco(2)
CISCO-VOICE-DIAL-CONTROL-MIB::cvVoIPCallActiveSessionProtocol.929517342.1 = INTEGER: cisco(2)
i also noticed the graph template is graphing “total” instead of “item”.. I would have thought the item count would be the number of active calls ?
Hi folks,
thanks heaps for sharing the templates.
Is someone able to share scripts/ss_total_snmpwalk.php ?
the template defines a data input method “SNMP – Total all values of snmpwalk” which wants ss_total_snmpwalk.php but it is missing from the zip file?
Thanks!
Sorry about that Wing – I didn’t know the file was missing. I’ve updated the download to include ss_total_snmpwalk.php.
Thank you for letting me know it was missing.
Have you done any monitoring of PRI loads on the routers themselves? I can’t seem to nail down the correct index in the MIB for my 2911 routers that have PRI cards in them. The indexes that Cisco has documented don’t seem to be on my router. Thanks for the article! Great job on the wallboard project as well!
I do monitor the load of our PRIs here at work. You’ll have to play around with it a bit, but I use SNMP (on my 3845s) to pull this OID
.1.3.6.1.4.1.9.9.63.1.3.2.1.6
cvVoIPCallActiveSessionProtocol .1.3.6.1.4.1.9.9.63.1.3.2.1.6The object specifies the session protocol to be used for Internet call between local and remote router via IP backbone.
Give me a few and I’ll see if I can’t export this and post it here.
-update-
To elaborate on this a bit, this will total up all the PRI calls on the router. Meaning, I have 5 PRIs plugged into my 3845, so this graph shows 50 calls right now.
I’ve posted the PRI template that I’m currently using. I’d appreciate any feedback you have about this template – especially if it works for you.
what I was looking for was an explanation of the call manager services that I can monitor with cacti … I currently have it setup but the only thing I can get from it is Memory usage.
Dr.T
Sorry for the delay in my reply, but you’re right – the default cacti template can do some general monitoring, but don’t help us very much for phone specific stuff. I’ve just uploaded a template that will monitor the number of registered phones. This is pretty useful, especially if you setup a cacti threshold that alerts you if X number of phones drop offline.
I’ll be uploading some more templates shortly.
I was about to applaud when I found this post .. then I read it and found out you didn’t explain anything about adding call manager … you talked about routers and switches ..
You’ll need to enable snmp on your callmanager as outlined in the link to Cisco.com. Once that’s done you can monitor traffic.
I’ll see about posting some good cacti templates that will allow you to monitor call manager better.
Excellent post, howto’s are always great. You might want to include the paragraph from cacti’s website at the top (for those of us that has no clue):What is Cacti?Cacti is a complete frontend to RRDTool, it stores all of the necessary information to create graphs and populate them with data in a MySQL database. The frontend is completely PHP driven. Along with being able to maintain Graphs, Data Sources, and Round Robin Archives in a database, cacti handles the data gathering. There is also SNMP support for those used to creating traffic graphs with MRTG. I haven’t tried to set it up yet, I’m using MRTG at the moment, but it might be worth considering moving to the more advanced Cacti. If possible, it would be great to turn this into a QPKG, and give some extra examples on setups. Btw. why install a new MySQL?And why the new PHP?
Yes, Youre right. Cacti installed and configured on debian virtual machine vmware(created on vsphere 1.0, running on vserver 2.0). I monitor debian vm, some printers, router, 2 servers(SLES[yet snmp cannot connect to him but working on that] W2K8R2), windows xp hosts. On windows hosts is installed smartmon tools for windows. smartctl -a /dev/sda recognizes the hdd and writes on cmd cli values of smart so it works directly on host. Maybe is it possible to rewrite script to work with smartctl on windows host?
Good call, I’m going to add a bit of cacti info now.